Productivity drives your business.
But relying solely on spreadsheets and timestamps isn’t going to cut it anymore.
You don’t just need to see when a pick was slow, you need to see WHY it was slow — so you can coach operators and improve processes.
That’s the only way to really improve productivity
In this playbook, we’re going to show step-by-step how our customers are using AI labor standards to get an augmented view of their productivity so they can take performance to the next level.
Or take an interactive product tour to see some of our productivity functionality in action.
How it works
Get a look at the average performance of your warehouse(s)
View a scorecard of your historical lowest performing operators
Establish your "exception" threshold and turn on productivity video alerts
Review video alerts to find opportunities to skyrocket productivity
The Playbook
Step 1: Get an overview of the average performance of your warehouse(s)
Productivity is the heartbeat of a warehouse. There are ebbs and flows throughout the day, week, and month, but the key is to keep a steady pace.
And the best way to do that is to be able to see —in real time— how you’re trending against your KPIs.
For an easy overview of your productivity and how you’re trending across your different activities, hop into the OneTrack Platform > Reports > Click to Load a Report > OnePX > Summary Dashboard.
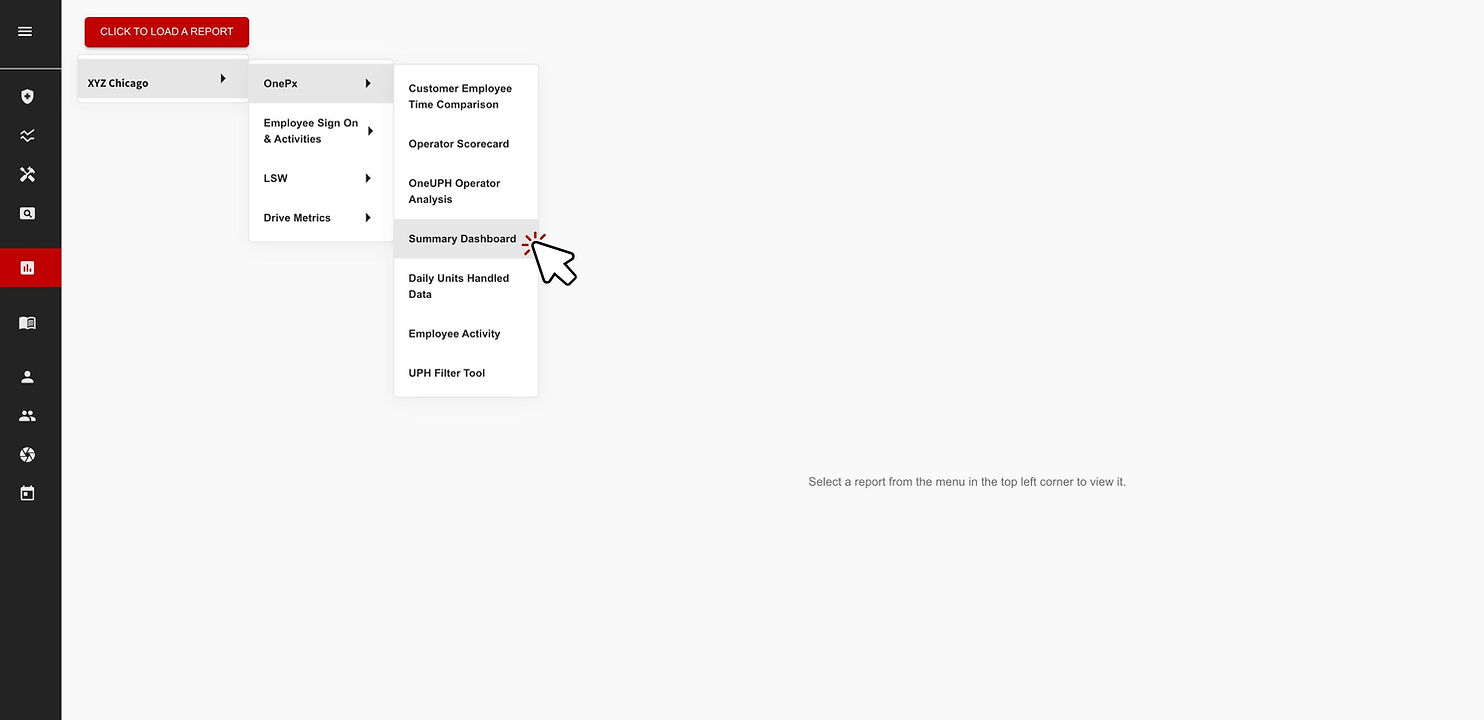
Make sure you set your filters to look at what time frame and plant(s) you want to analyze. For now I want to look at XYZ Chicago for the past 14 days.
This dashboard is pulling in data from your WMS and/or LMS to help you visualize a time breakdown across your warehouse or network.
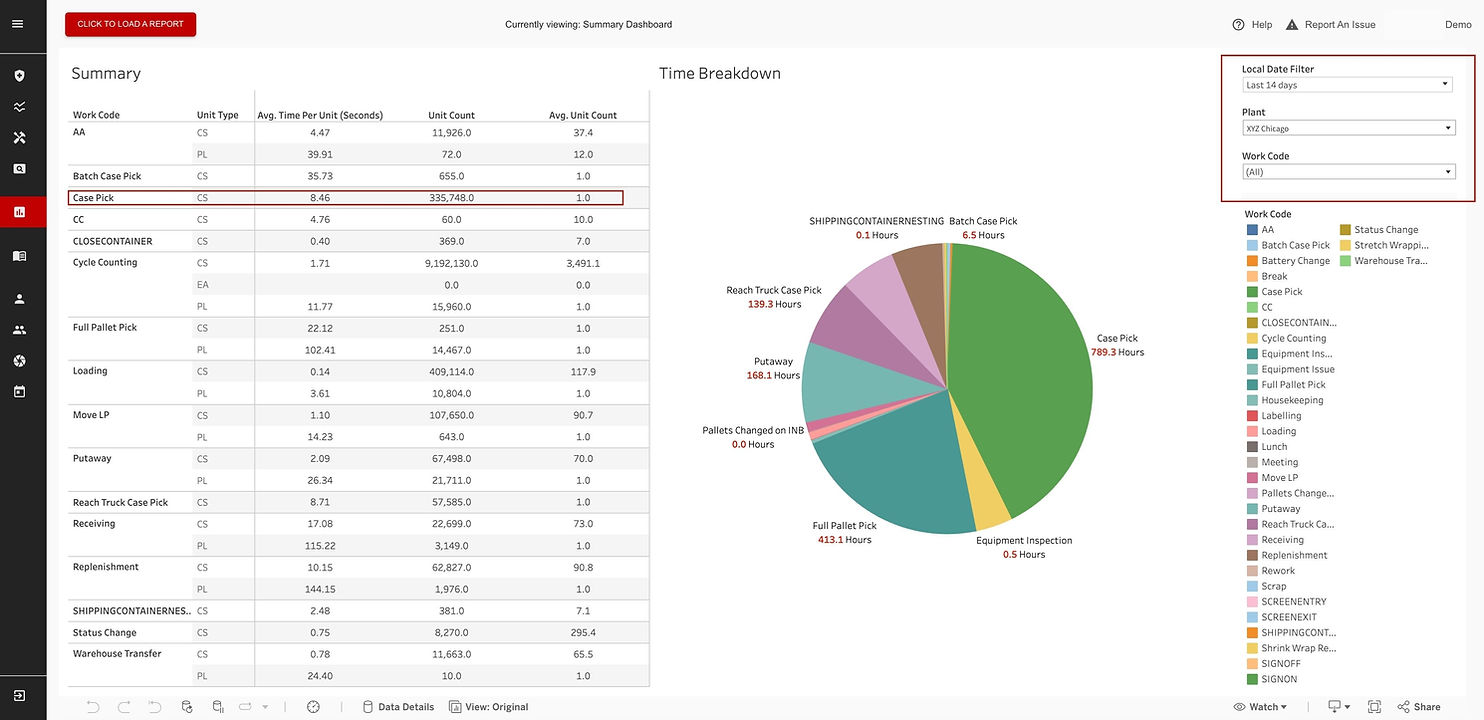
Then you can look at specific work codes to see how you’re performing on average.
For example I can see that over the last 2 weeks, we’re averaging 8.46 seconds per case pick which is slightly worse than my KPI of 7 seconds per case. I can also see how many units we’re moving in each work code to make sure volume looks right.
I see this as your control center. One place to easily see volume, your averages, and how you’re performing against KPIs so you can take relevant action as needed.
But once we find an issue, how can we diagnose it, and then fix it?
Step 2: Dive into a scorecard of your lowest performing operators
First let’s take a granular look at a specific site (or sites) performance, and then we’ll look how to turn a bottom-of-the-barrel operator into a top performer.
Click to Load a Report > OnePX > Operator Scorecard.
By default, this will show you some in-depth productivity stats for every operator at a given site — or across your network.
But you can also filter by specific operators to help with performance reviews and by specific work codes (coming from your WMS, LMS, or OneTrack’s activity tracking), in this case I'm looking at case picks.
This report shows:
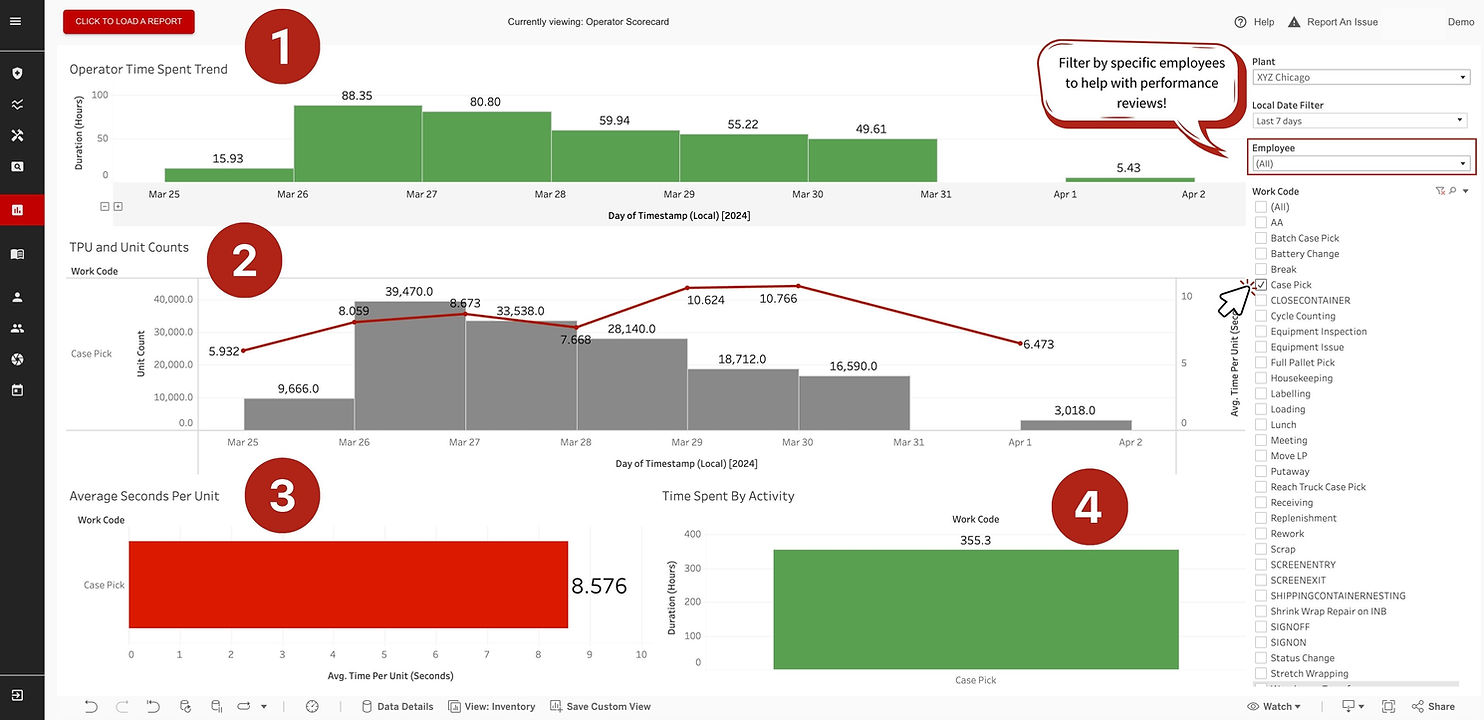
- Total time spent by operator in specific work codes by month, week, day, or even by hour.
- How an operator is trending by average time per unit over a given time period.
- Their overall average time per unit for that time period.
- And overall time spent per activity.
Step 3: Establish your "exception" threshold and turn on video alerts
So now you have your performance cockpit, and a great tool for performance reviews and keeping track of individual operators — but there’s so much more we can do to boost productivity.
One of the features that set’s OneTrack apart is the ability to not just see what or when something happens, but to actually see WHY it happened.
This opens up behavioral coaching for operators and the ability to find broken processes in real-time. Huge levers to boost performance.
But first we need to figure out what our “exception threshold” should be to start.
Every operation has different KPIs, but the process remains the same.
Click to Load a Report > OnePX > UPH Filter Tool
For this example I want to dig into my case picks, so I'll filter by that work code.
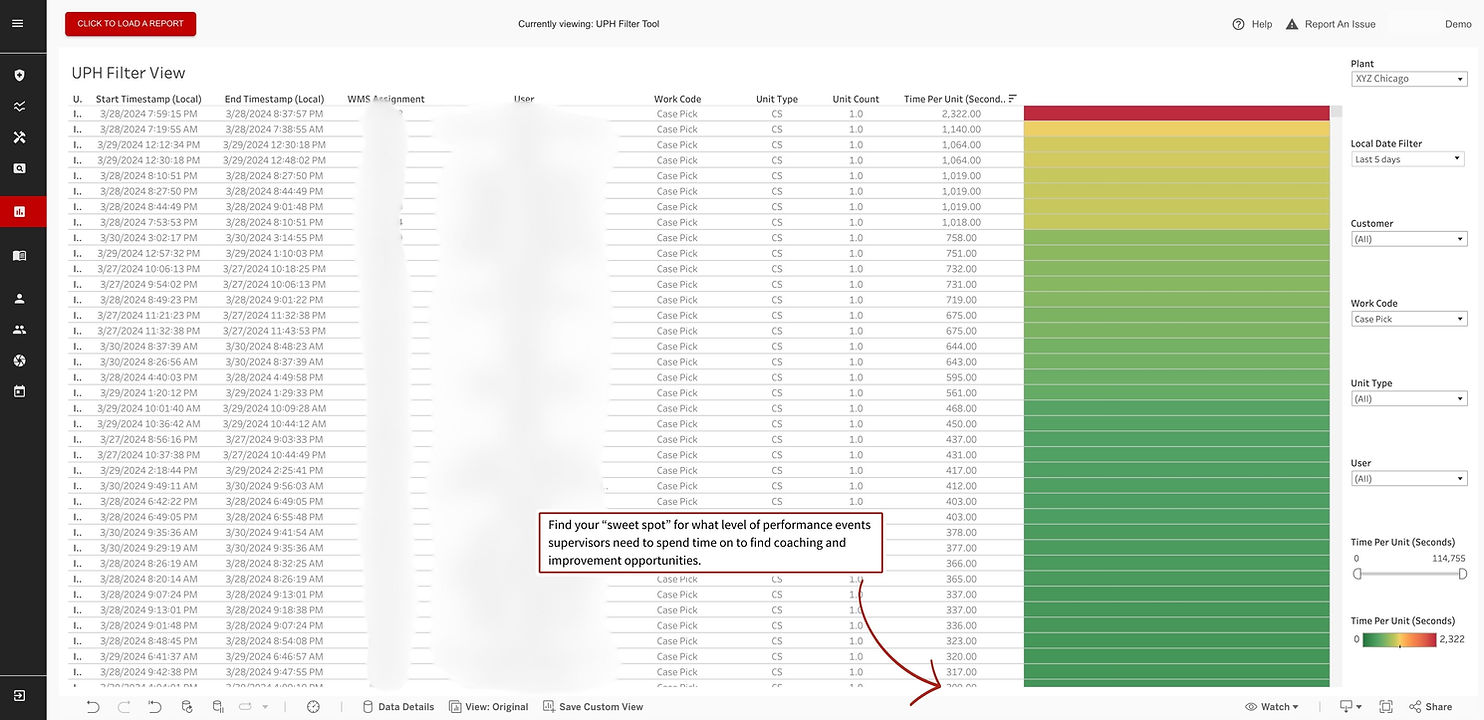
This is going to let you see a couple of things:
A list of every activity (based on your WMS), that you can sort by time spent. Another good way to look at performance and keep a finger on the pulse.
This is also going to give you a good idea of your “exception” time.
Say my average case pick KPI is supposed to be 7 seconds. Well, with OneTrack I can start getting video events sent based on productivity.
Do I want them after 9 seconds?
Probably not, my supervisors will be inundated with events. Instead I can use this and see that I have had several case picks last more than 300 seconds over the last 3 days.
Not so low that it’ll overwhelm my team but also high enough that every event should be an opportunity for improvement.
Step 4: Get an overall network view of your MHE fleet
Now for the fun part.
Video alerts are turned on and I’m receiving events. Let's see what we can find.
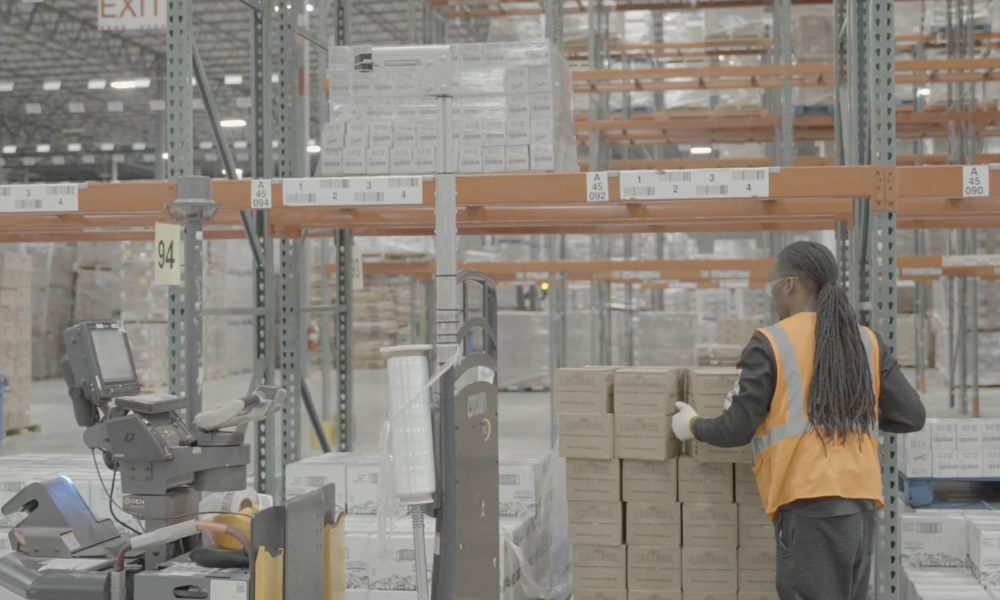
This example took 313 seconds for one case pick (based on the WMS data). It’s a prime example of why context is so important.
Without the video, I might think the operator is a low performer. But in reality it’s a broken process that our leadership team needs to address.
- Had to move a pallet to access the one he really needed
- Had to remove shrink-wrap and throw it away before completing the pick
Knowing that we can develop a better system to design put-aways so it’s easier to navigate, and ensure that removing shrink-wrap is done in the put-away process, not during a case pick.
Classic example of a coaching opportunity. Couple things I saw here:
- The operator is standing around talking, then move the lift, and goes back to talking
- Walks under and rack instead of using a walkway
With video alerts like this it set’s a standard of behavior.
No one should use OneTrack as a “Gotcha!” tool. But it is about holding people accountable for their performance standard.
After a coaching conversation or two, this operator will quickly understand what’s acceptable, what isn’t, and just like that a low performer can turn into a top performer.
But almost more important is the ability to coach them on always using appropriate walkways instead of going between racking. Huge safety hazard avoided.
Want to put this playbook to work for yourself?
This playbook will help you go beyond static spreadsheets or KPIs on bulletin boards and move into real-time productivity alerts — where every event is an opportunity to improve operator performance or find a process improvement.
A system that learns and grows with your unique operations, using AI to help you skyrocket productivity.
In just a few minutes you now have data on:
- How you warehouse(s) is performing at a high-level, including average UPH and total volume by activity
- Granular performance data for all of your operators
- The ability to quickly identify processes that need supervisor attention
- Real-time video alerts showcasing improvements that can save you countless hours (and dollars)
That's the future of warehouse productivity.
Want to put this kind of data to work in your warehouses?
OneTrack customers, good news! You already have this at your fingertips (if your WMS is connected). Reach out to your implementation manager or support team with any questions.
Or if you want to get your WMS connected, it’s surprisingly easy and we can help with that too.
If you aren’t a OneTrack customer, book a custom demo here. We’ll connect to better understand your operations and show you what a partnership could look like.